Navigating Precision and Recall: A Practical Approach for Businesses

In the dynamic world of machine learning, businesses often find themselves in a delicate dance between avoiding false alarms and seizing every opportunity. Striking the right balance is where precision and recall metrics come into play. But not everyone is familiar with the two metrics.
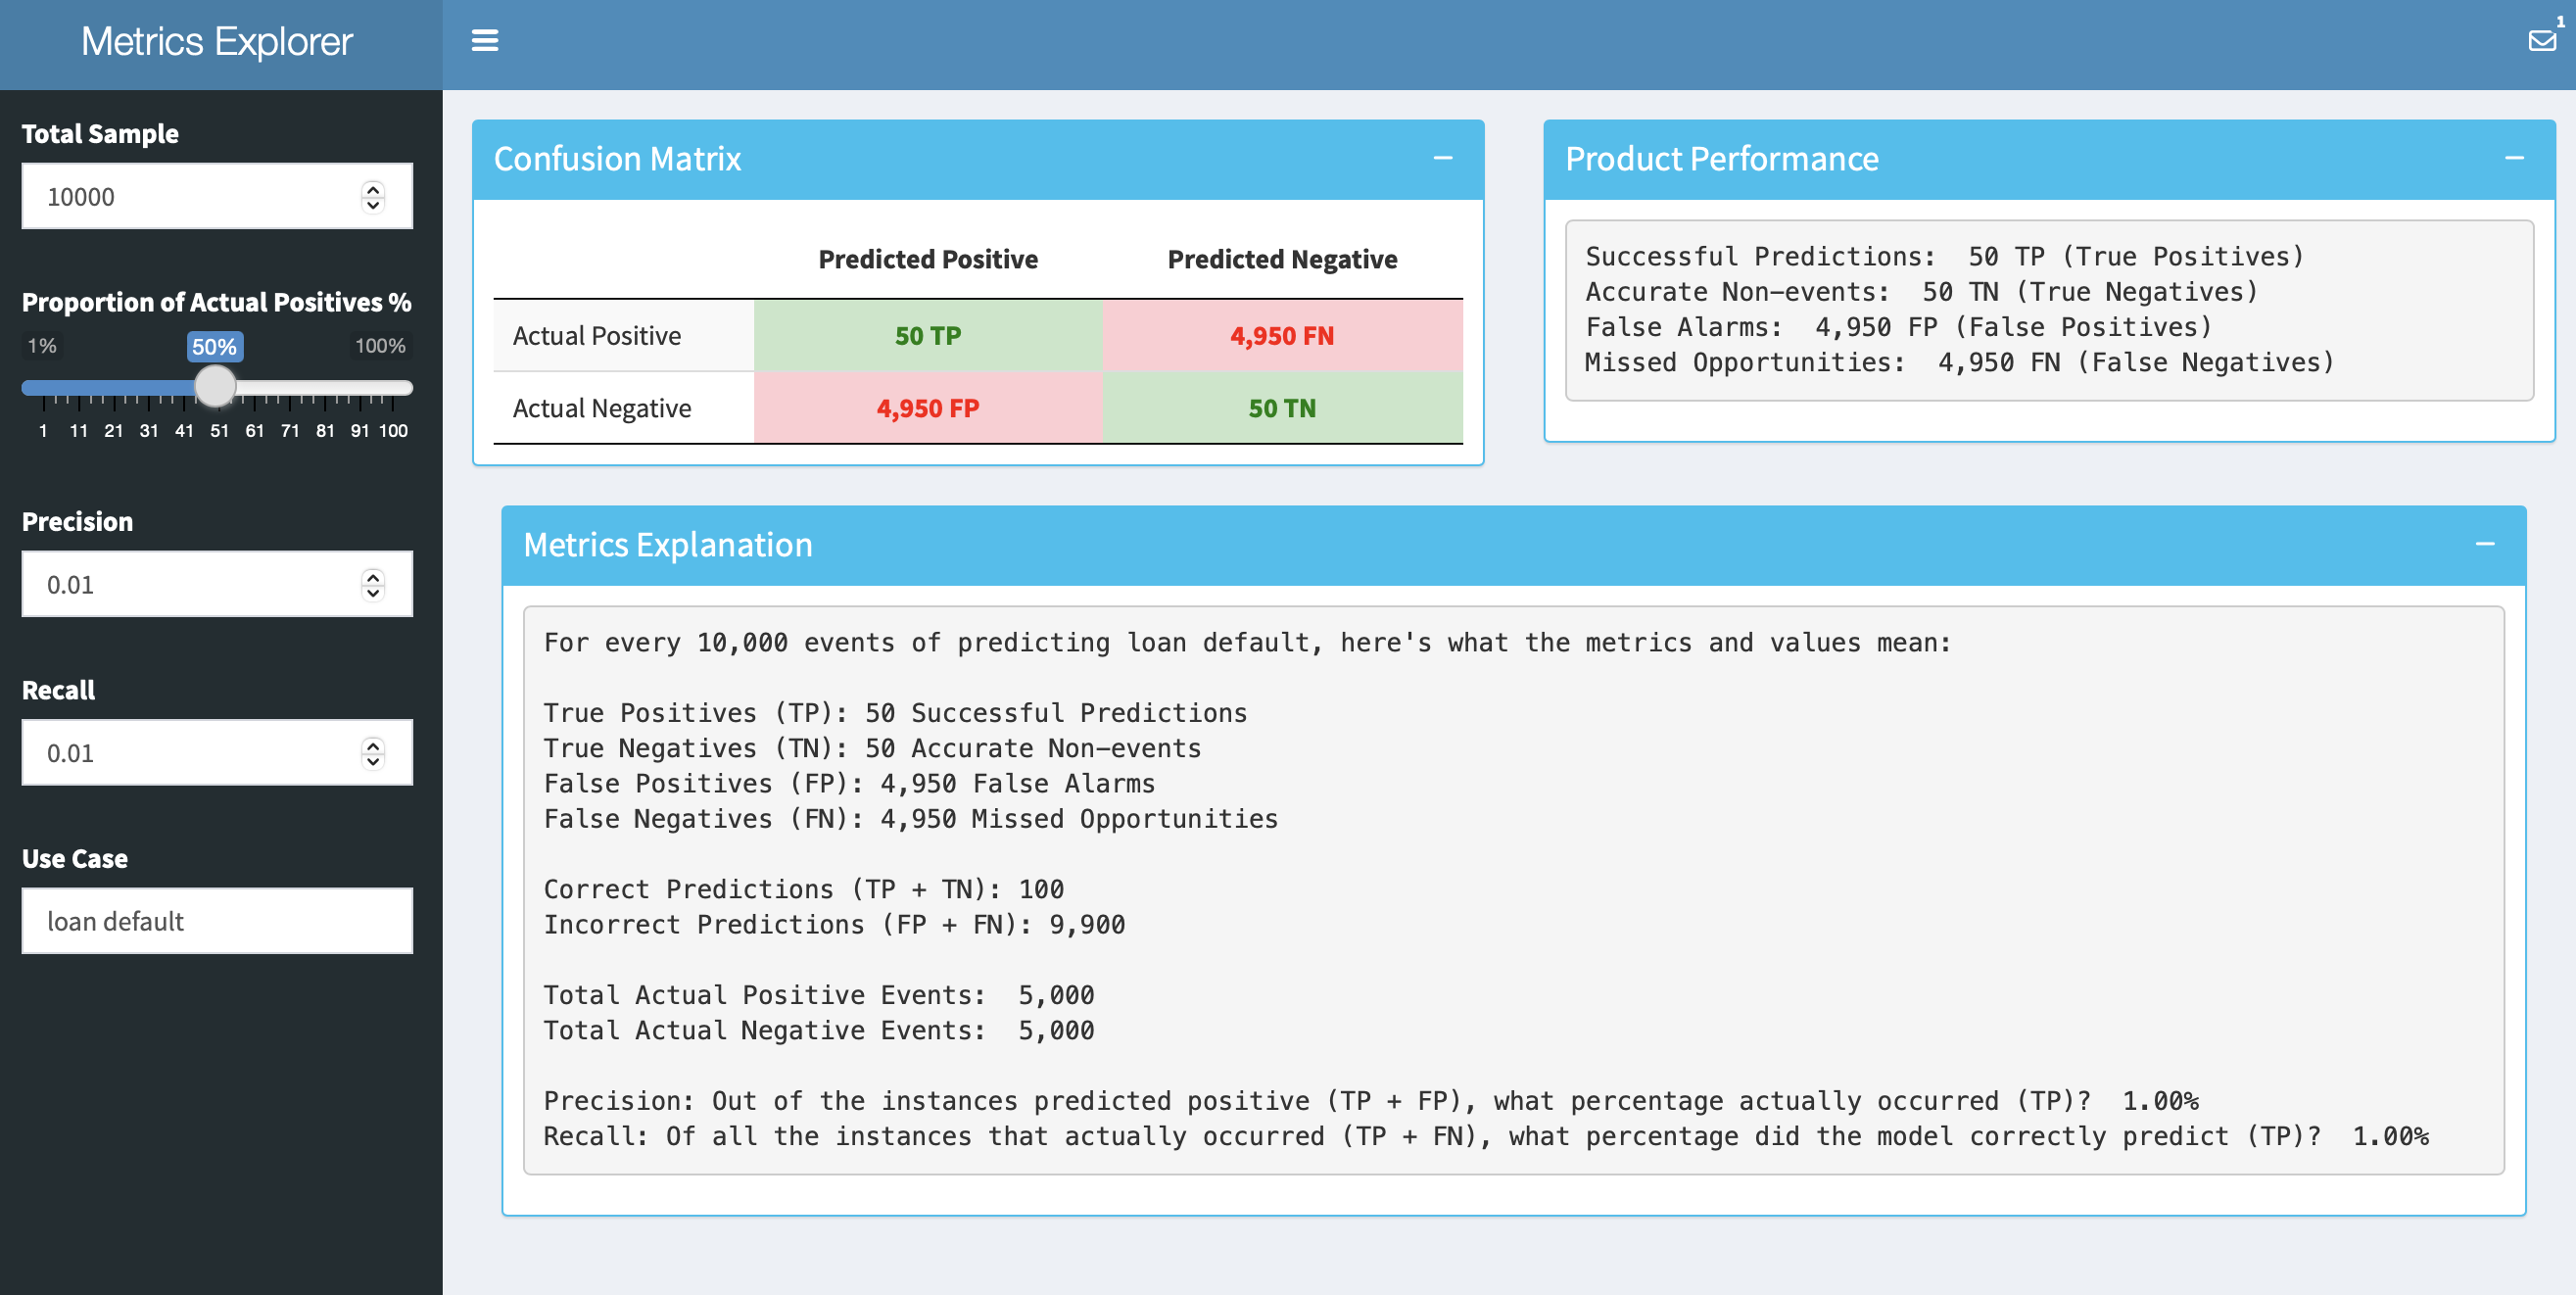
To make these metrics more approachable, I’m excited to introduce the Metrics Explorer Shiny app (deployed on shinyapps.io). This tool is designed to make business users a bit more comfortable around the confusion matrix and allow them to interactively explore how different precision and recall values impact real-world scenarios.
What to Expect
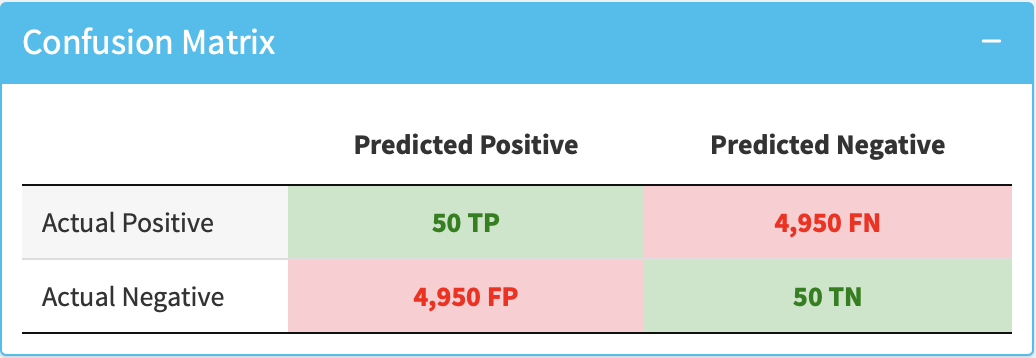
- Confusion Matrix:
Visualize the effects of tweaking precision and recall values on a confusion matrix.
Fact check of predictions.
- True Positives – Prediction says positive, the reality agrees.
- True Negatives – Prediction says negative, the reality agrees.
- False Positives – Prediction says positive, the reality isn’t.
- False Negatives – Prediction says negative, the reality isn’t.
- Performance Insights:
- Peek behind the curtain of your model with key metrics:
- Successful Predictions (True Positives) – because who doesn’t love a win?
- Accurate Non-events (True Negatives) – the unsung heroes that keep things in check.
- False Alarms (False Positives) – the unexpected surprises.
- Missed Opportunities (False Negatives) – the ones that got away.
- Peek behind the curtain of your model with key metrics:
- Metrics in Plain Language:
- Gain insights into precision and recall metrics without getting lost in jargon:
- True Positives (TP): Successful Predictions – when the model hits the bullseye.
- True Negatives (TN): Accurate Non-events – quietly doing their job.
- False Positives (FP): False Alarms – the occasional false alarm.
- False Negatives (FN): Missed Opportunities – the ones that slipped through the cracks.
- Gain insights into precision and recall metrics without getting lost in jargon:
Tweak, Play, Learn
- Total Sample: Adjust the number of events to mirror your real-world challenges.

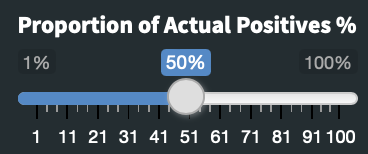
- Proportion of Actual Positives: Reflect the reality of positive events in your business landscape. With the same precision and recall, different proportion of actual positives will get us different number of correction predictions.
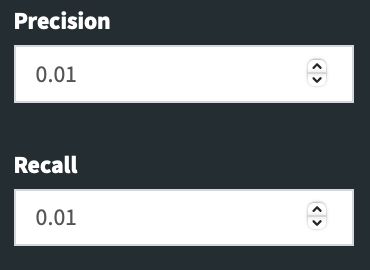
- Precision and Recall: Fine-tune these settings to witness their impact on your model’s performance.
- Use Case: Tailoring the discussion to your business scenario can be a breeze. You can update the input and the write-up will be updated accordingly. If your focus is on “loan default prediction,” the app can be your storytelling companion, revealing how precision and recall unfold in the unique context of predicting loan defaults and showcase the business impact.

Closing Thoughts
In a nutshell, business stakeholders don’t need to master the precision and recall metrics but the actual impact to the business.
By interactively playing with total sample, actual positives proportion, precision and recall, stakeholders can see the realistic false alarms and missed opportunities and identify the right metrics.