Use R for more than statistical analysis
About me
Tiger Tang - Data Science Manager at CARFAX, building a team specialized in data mining and natural language processing. I am dedicated to bringing business value to data science folks using data science tools, and I am passionate about growing the Data Science community.

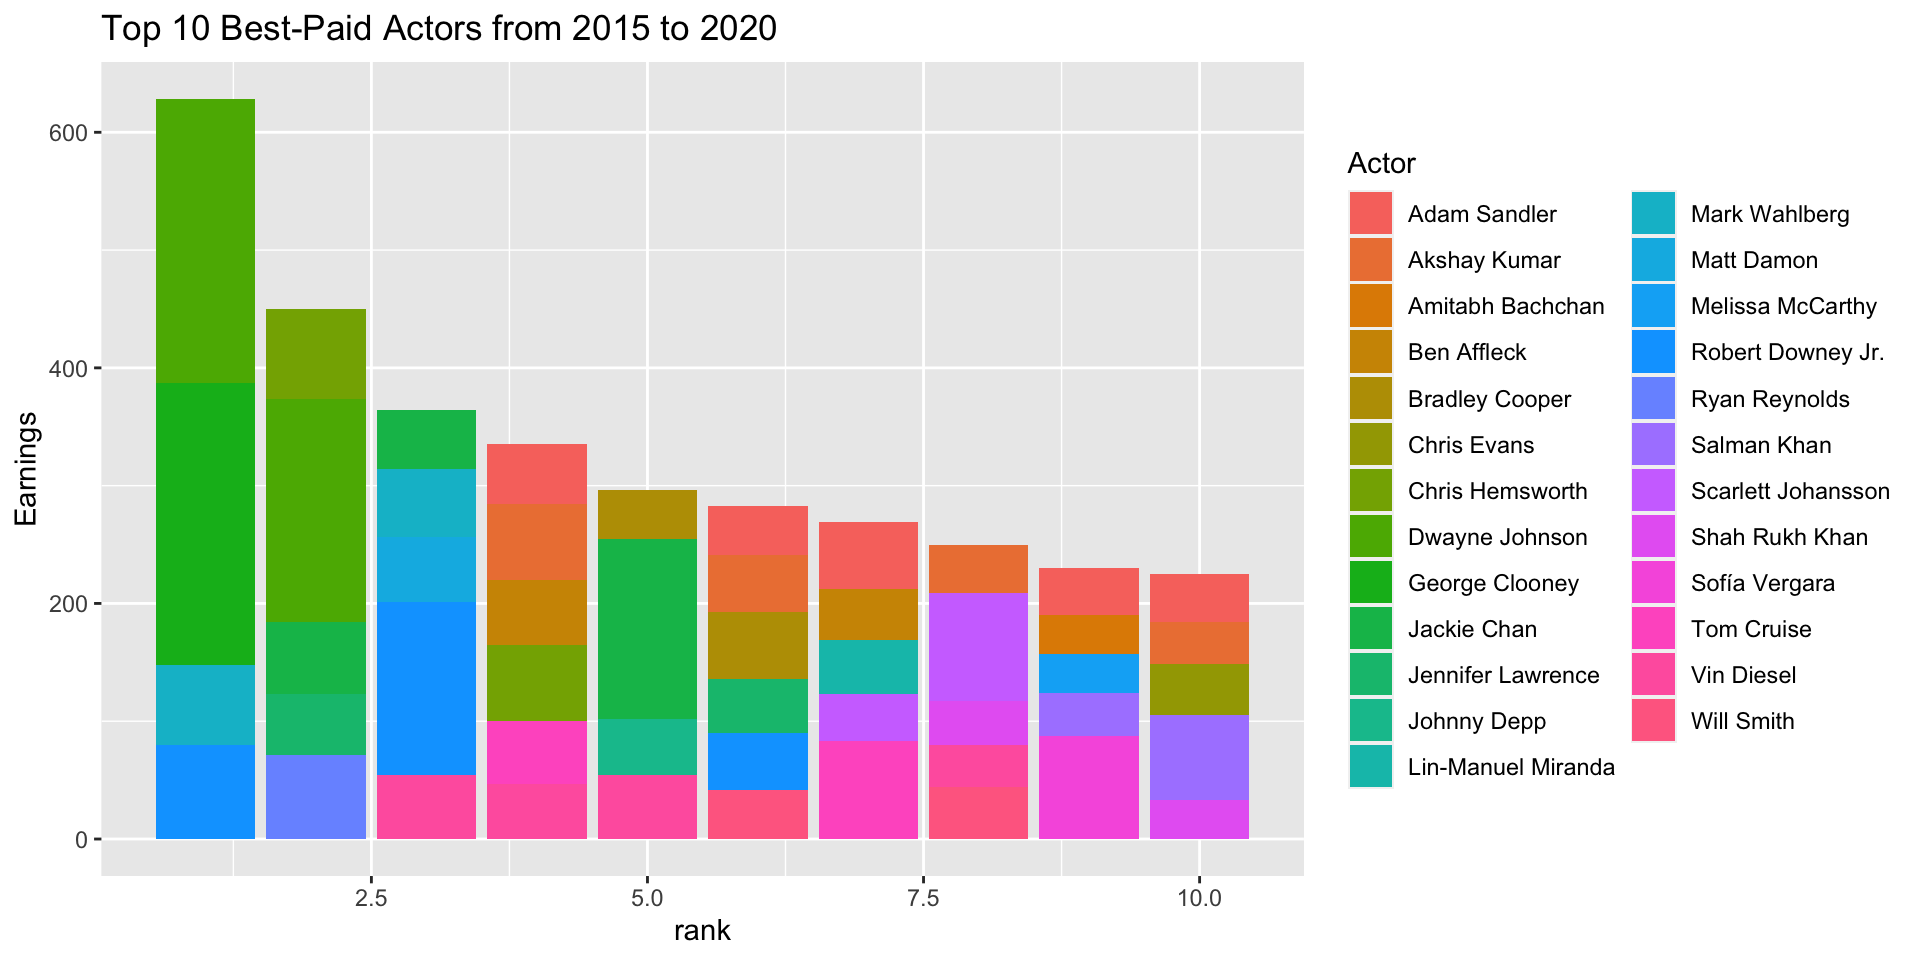
Create tiktok materials
You probably have seen videos shows the trend of something. The #barchartrace has over 37M views on tiktok.

This is something you can totally build using R.
Create tiktok materials

Combined with image data from wiki, you can load the data as below
Rows: 60
Columns: 6
$ Rank     <dbl> 1, 2, 3, 4, 5, 6, 7, 8, 9, 9, 1, 2, 3, 4, 5, 6, 7, 8, 9, 10, …
$ Actor    <chr> "Robert Downey Jr.", "Jennifer Lawrence", "Jackie Chan", "Vin…
$ Earnings <dbl> 80.0, 52.0, 50.0, 47.0, 41.5, 41.0, 40.0, 35.5, 33.5, 33.5, 6…
$ year     <dbl> 2015, 2015, 2015, 2015, 2015, 2015, 2015, 2015, 2015, 2015, 2…
$ img      <chr> "https://upload.wikimedia.org/wikipedia/commons/thumb/9/94/Ro…
$ rank     <dbl> 1, 2, 3, 4, 5, 6, 7, 8, 9, 10, 1, 2, 3, 4, 5, 6, 7, 8, 9, 10,…
Create tiktok materials

library(ggplot2)
library(ggimage)

barchart_02 <- barchart_01 +
  geom_text(aes(label = paste0(Actor,round(Earnings,digits = 2)," M"))) +
  theme(axis.text.y = element_blank(),
        panel.grid = element_blank(),
        legend.position = "none",
        axis.ticks.y = element_blank(),
        axis.title.y = element_blank(),
        plot.title = element_text(size=22)) +
  scale_y_continuous(labels = scales::label_number(suffix = " M",prefix = "$"))+
  coord_flip(expand = F,clip = "off") +
  scale_x_reverse() +
  geom_text(aes(x=10, y= 200, label = as.factor(year)),
            vjust = 0.2,
            alpha = 0.5,
            col = "gray",
            size = 20)
barchart_02Create tiktok materials
Explore NYC metro traffic
MTA Turnstile Data provides the entries and exits info for all New York subway turnstiles within stations. It contains weekly logs of cumulative entries and exits per turnstile per subway station at some time interval.
Explore NYC metro traffic
Data is available on MTA website.

Latitude and longitude were obtained from another data table.
Explore NYC metro traffic
# Inspired by Drew Conway's post in 2011:
library(ggplot2)

hour.pos <- seq(0, 12, 12/(12*60))[1:720]
min.pos <-seq(0,12, 12/60)[1:60]
all.hours <- rep(hour.pos)
all.times <- cbind(all.hours, min.pos, 12)

i = 2
cur.time <- data.frame(list(times=c(all.times[i,1],
                                    all.times[i,2]),
                            hands=c(.5, 1)))

ggplot(cur.time, aes(xmin=times, xmax=times + 0.03,
                              ymin=0, ymax=hands)) +
  geom_rect(aes(alpha=0.5))+
  scale_x_continuous(limits=c(0,all.hours[length(all.hours)]),
                       breaks=0:11,
                       labels=c(12, 1:11)) +
  scale_y_continuous(limits=c(0,1.1)) +
  scale_alpha() +
  theme_bw() +
  coord_polar() +
  theme(axis.text.y=element_blank(),
        axis.ticks=element_blank(),
        panel.grid.major=element_blank(),
        strip.background = element_rect(colour = 'white'),
        legend.title = element_blank(),
        legend.position = "none")
Explore NYC metro traffic
Check out full details on shiny gallery.
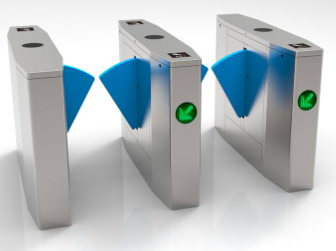
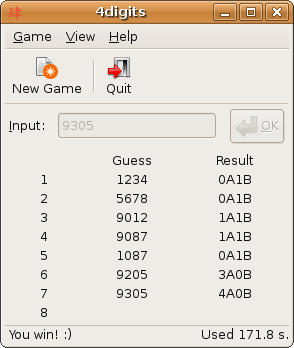
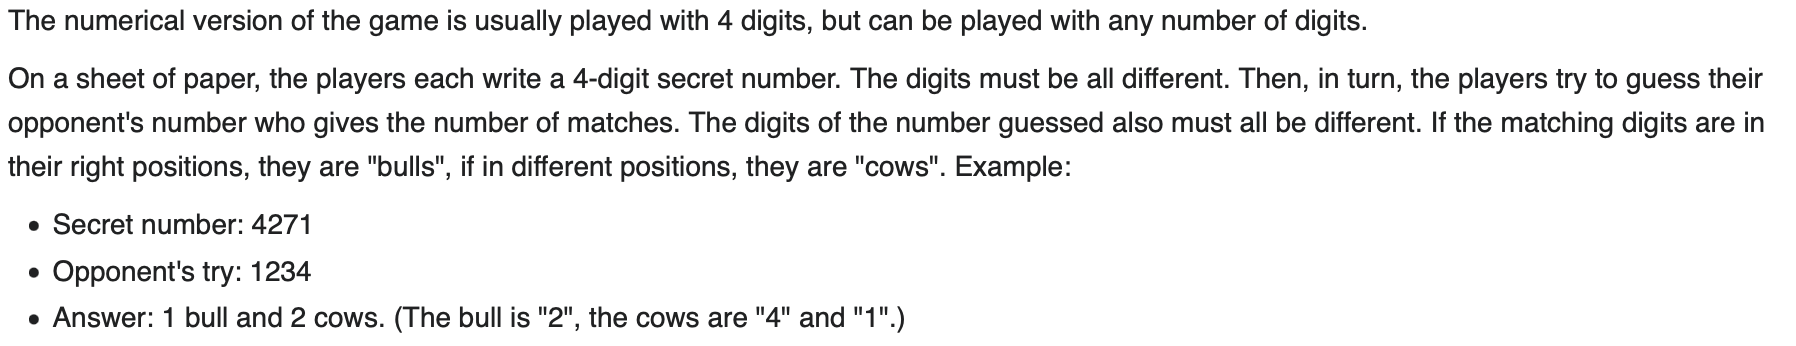
Create a “hit” game
About 20 years ago, on a device like this below, I played a number-guessing game, also known as Bulls and Cows. The hit game on New York time Wordle, is the word version of this.


Create a “hit” game
library(tidyverse)
split_pluck <- function(number){str_split(number,pattern = "") %>% pluck(1) %>% unique()}

guess_this <- function(x,y) {

  x_numbers <- split_pluck(x)
  y_numbers <- split_pluck(y)

  correct <- data.frame(x_numbers,y_numbers,stringsAsFactors = F) %>%
      mutate(compare = x_numbers == y_numbers) %>%
      summarise(sum = sum(compare)) %>%
      pull(sum)

  correct0 <- sum(x_numbers %in% y_numbers)
  if (correct > 0) {correct1 <- correct0 - correct} else {correct1 <- correct0}
  if (correct==4) { "Yeah you got it!"} else {sprintf("%sA%sB",correct,correct1)}
}Create a “hit” game
Add the rules for new users.

Create a “hit” game
Added the feedback UI to smooth user experience.
Create a “hit” game
Like every other game, there is a leader board for people their records order by the least number of trials it took.
Create a “hit” game
In case the game gets too popular, it is also implemented with async programming, which would allow multiple users to play the game at the same time.
See the guessing in action. 
Natural Language Processing
Service and Maintenance records can describe the same action in many different formats.
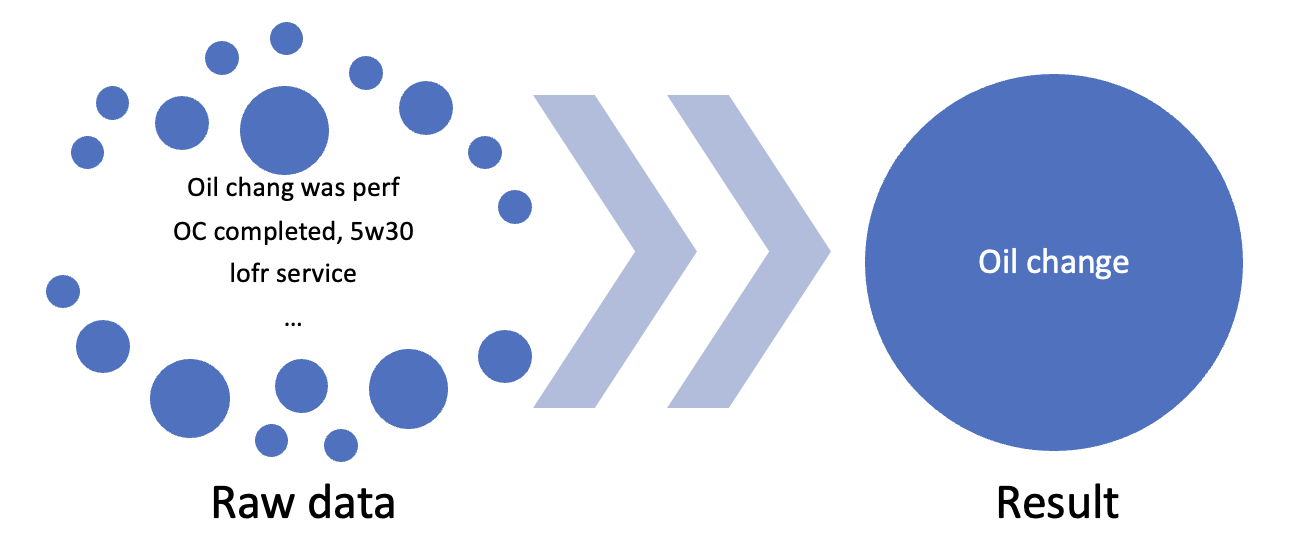
Let’s image solving this problem for billions of records and hundreds of services in addition to oil change.
Natural Language Processing
You can access popular deep learning frameworks with R including but not limited to the following.
Natural Language Processing
R ecosystem offers helpful tools to help get the best solutions.

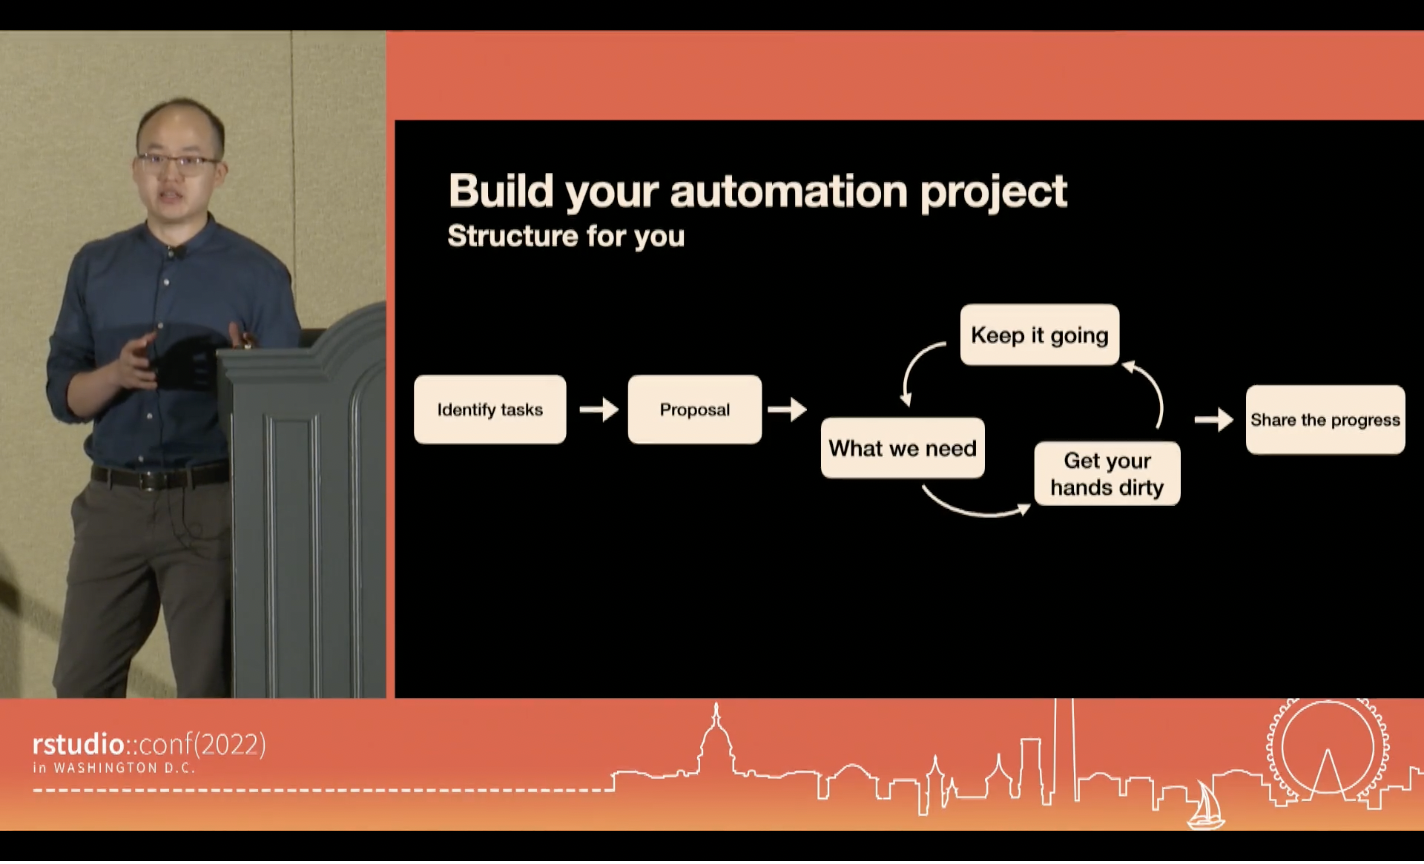
Work automation

I wish I could work like this…
Work automation
I realized that R may be the solution, as every application can be connected using R.

Work automation

My day after automation, I don’t even need the coffee now.
Work automation
After applying that to many processes in my organization, 12,000+ work hours have been saved. Check out the full talk on RStudio Conference 2022.