deckroadmap: Give your slides a sense of direction
Last weekend, I drove to New York.
Along the way, I kept passing signs that said things like “New York City 150 miles,” then later “88 miles”, then less and less as we got closer. The thing is, with GPS on, I barely needed those signs. The map was already telling me where we were, how far we had left, and what was coming next.
That constant sense of orientation is easy to take for granted. Somewhere during that drive, it hit me: Presentations need that too.
When people sit through a talk, they do not just want to know what slide they are on. They want to know where they are in the story.
Are we still in the setup?
Are we already in the analysis?
Is the recommendation coming next?
In PowerPoint, people often hack this together with manual shapes on every slide. But for those of us building Reveal.js slides via Quarto or R Markdown, there hasn’t been an automated way to keep the audience oriented.
That thought stayed with me, and by the time the weekend was over, it had turned into deckroadmap, a lightweight R package for adding roadmap footers to Quarto and R Markdown Reveal.js presentations, so audiences can see what has been covered, what section is active, and what is coming next.
![]()
The problem
Reveal.js already has a built-in progress bar, and it does its job well. But it answers a different question.
A slide progress bar tells you about distance.
A roadmap footer tells you about structure.
| Feature | revealjs Progress Bar | deckroadmap |
|---|---|---|
| Focus | Linear Progress | Narrative Milestones |
| Question Answered | “How many slides left?” | “What part of the story is this?” |
| Audience Impact | Passive tracking | Active orientation |
And in many presentations, structure is what people actually care about.
Getting started
The workflow is intentionally simple. You can install the package directly from GitHub:
# install.packages("remotes")
remotes::install_github("CodingTigerTang/deckroadmap")
1. Define your roadmap
In your setup chunk, define the major sections of your talk:
library(deckroadmap)

use_roadmap(
  c("Intro", "Problem", "Analysis", "Recommendation", "Next Steps"),
  style = "pill"
)
2. Tag your slides
Use the {data-roadmap} attribute in your Quarto or R Markdown headers to link a slide to a specific section:
## Welcome {data-roadmap="Intro"}

## The problem {data-roadmap="Problem"}

## Analysis overview {data-roadmap="Analysis"}

## Recommendation {data-roadmap="Recommendation"}

## Next steps {data-roadmap="Next Steps"}
Three built-in styles
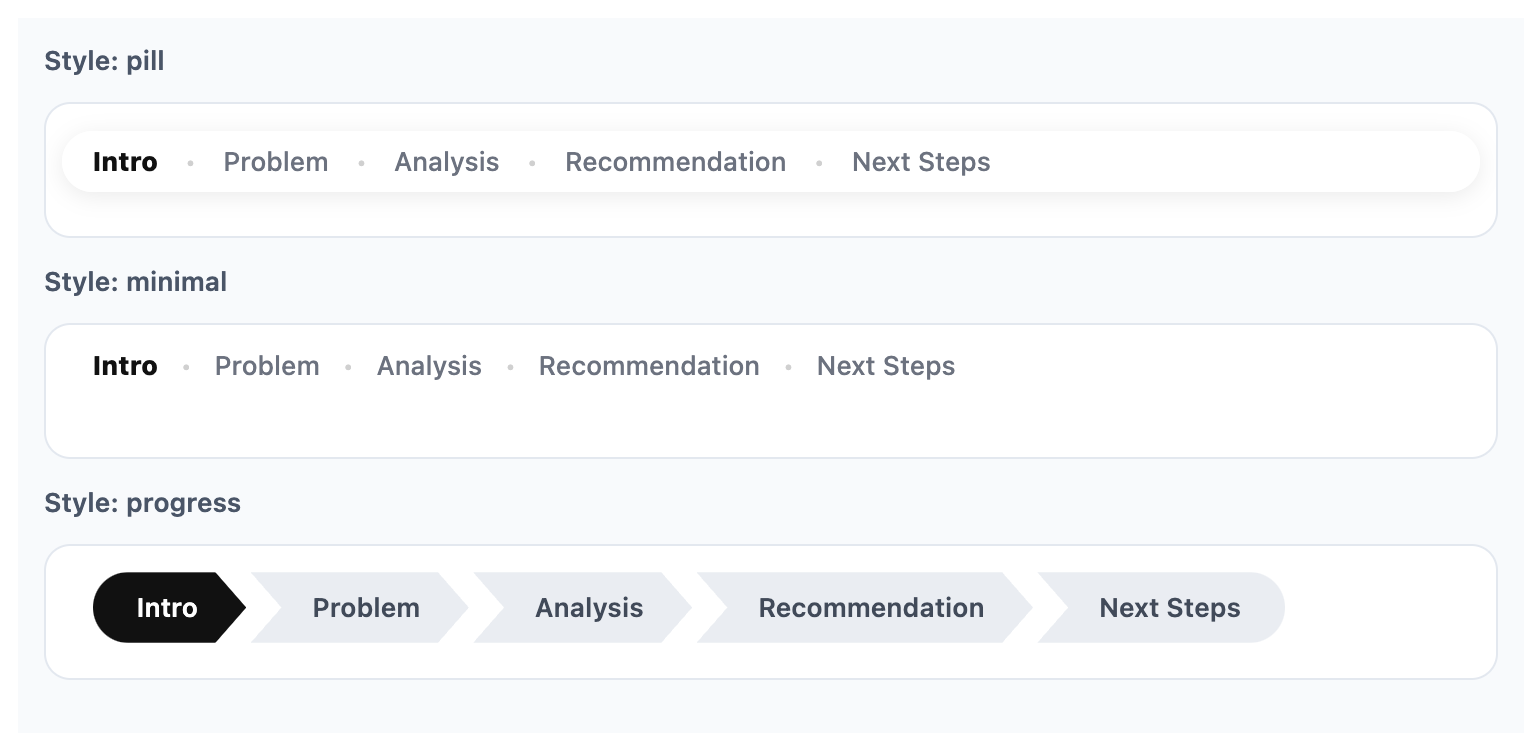
I wanted deckroadmap to be useful right away without requiring users to write custom CSS. It ships with three distinct “personalities”:
pill: a rounded floating footer with a polished presentation feel.
minimal: a lighter text-first version with less visual weight.progress: a more structured roadmap bar that makes done/current/upcoming very explicit.
A feature for iteration: preview_roadmap()
One thing I did not originally plan, but now really love, is preview_roadmap().
It allows you to preview a roadmap design locally before rendering an entire slide deck. That turned out to be surprisingly helpful while experimenting with styles, colors, and section names.
Why a package?
This could have stayed as a one-off CSS and JavaScript hack. But by packaging it, the workflow becomes cleaner and more shareable:
- Consistency: Use one function across multiple decks.
- Compatibility: Native support for both Quarto and R Markdown (Reveal.js).
- Speed: No more hunting for that one .css file you used six months ago.
Lastly
Presentations are not just about putting content on slides. They are about helping people follow a line of thought. Sometimes that means better visuals, and sometimes it just means helping people answer a simple question: Where are we right now?
If you want to give your next Reveal.js deck a sense of direction, give deckroadmap a try.
- GitHub: CodingTigerTang/deckroadmap.
- Docs: deckroadmap.
Sometimes a road sign is all it takes to start a package idea.